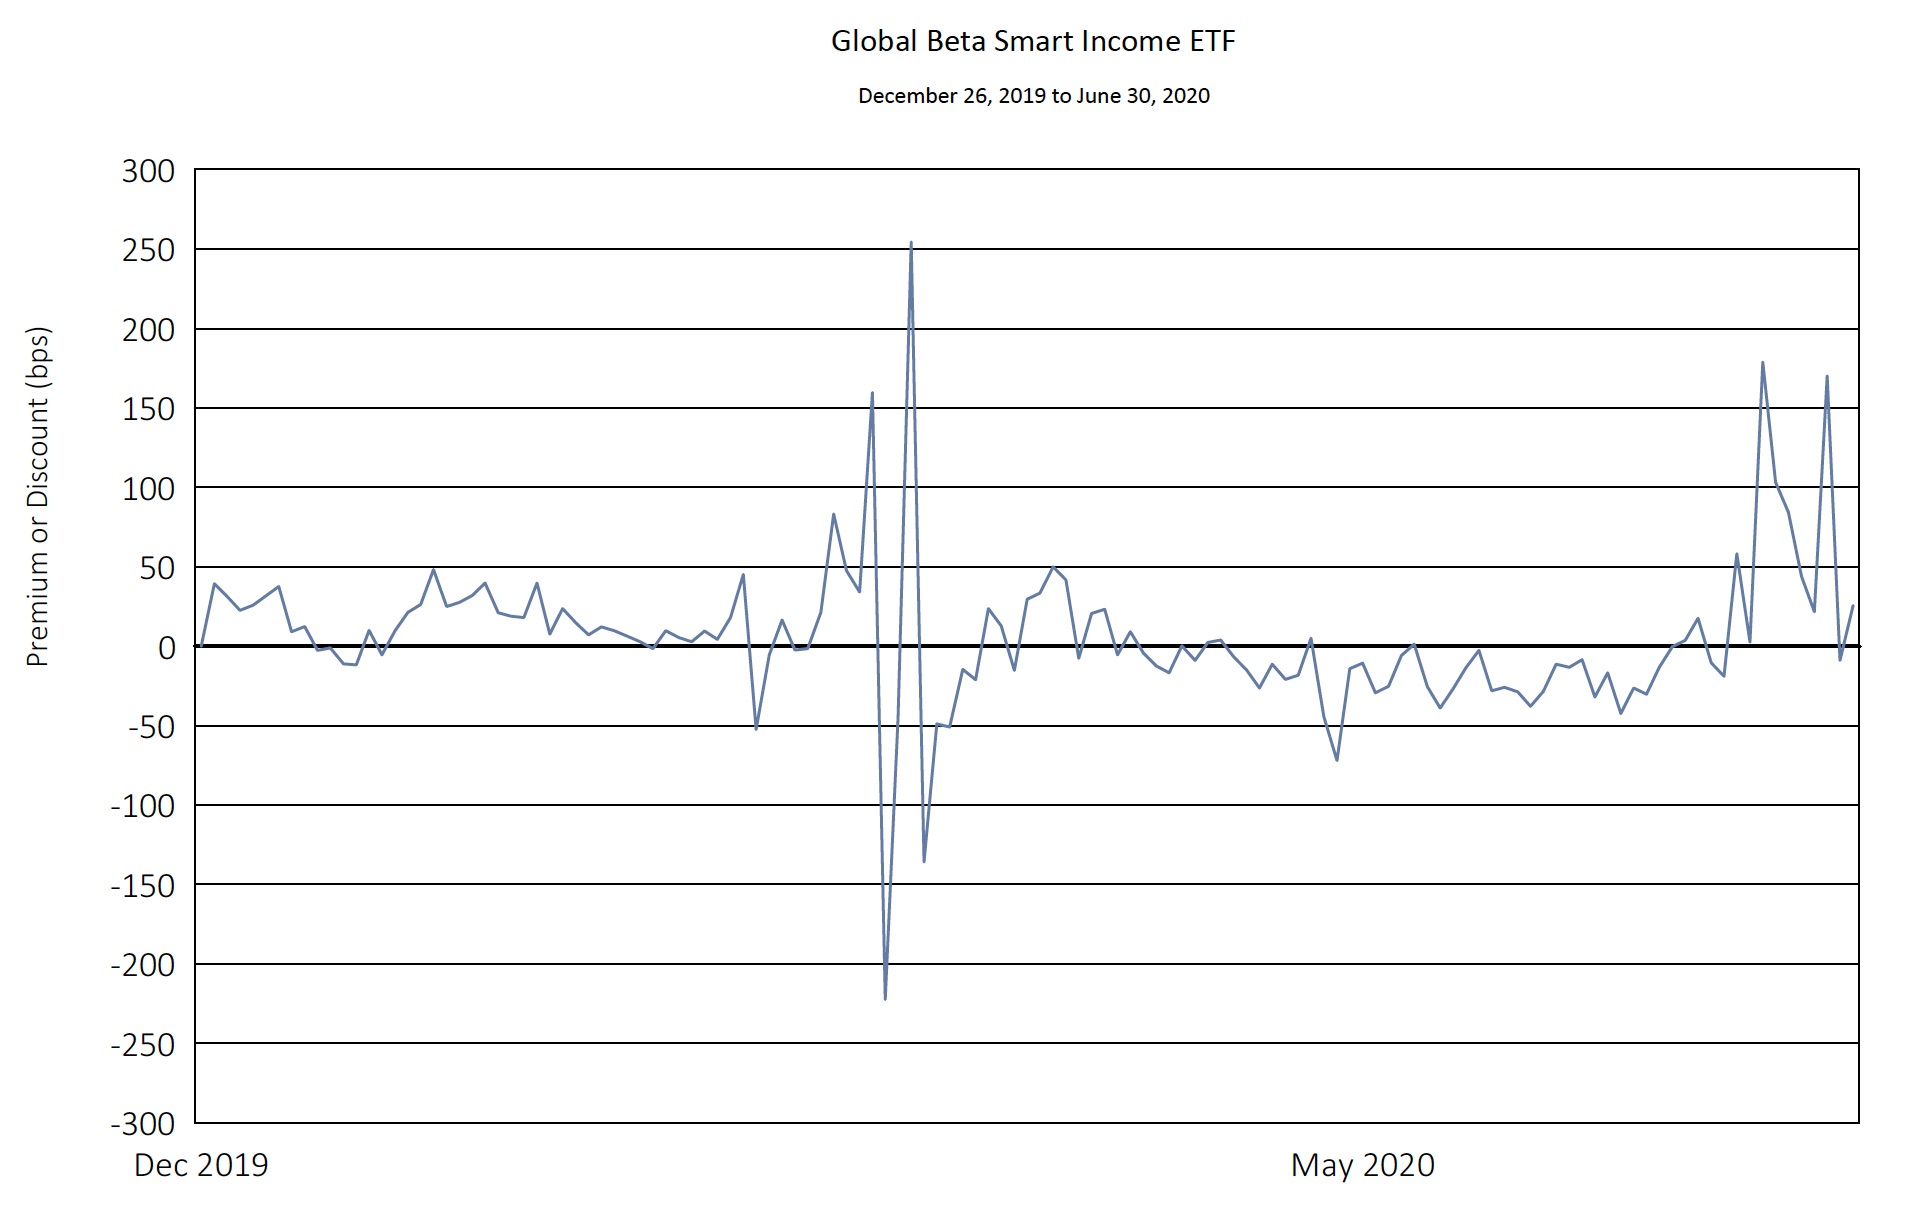
Premium or Discount

| Calendar Year 2019 | Calendar Year 2020 through June 30, 2020 | |
| Days Traded at Premium | 3 | 65 |
| Days Traded at Net Asset Value | 1 | 0 |
| Days Traded at Discount | 0 | 60 |
The above table and line graph are provided to show the frequency at which the closing price of the Fund was at a premium (above) or discount (below) to the Fund’s daily net asset value (“NAV”). The table and line graph represent past performance and cannot be used to predict future results. Shareholders may pay more than NAV when buying Fund shares and receive less than NAV when those shares are sold because shares are bought and sold at current market prices.


